In an effort to understand if NJ is currently undergoing a second wave of COVID-19 we will review four key metrics – reproductive number over time (Rt), cases, hospitalizations, and deaths – and how best to understand what is reported in the context of normal seasonal viruses.
1. Rt: The reproductive number calculated over time, is often reported as an metric to guide our policy decisions although it is clear from this Nature piece, A guide to R – the pandemic’s misunderstood number, that it is limited in its usefulness. One problem is that the calculation is laden with assumption that are not always made public. Case in point, NJ reported a Rt of 1.42 on 11/17/20 while the Harvard T. H Chan School of Public Health estimated a Rt of 1.29 on the same day.
2. Number of Cases: Unfortunately, cases are not a useful metric to track our second wave. The explanation why is three-fold, dealing with percent positivity, false positives generated from PCR testing, and how NJ reports cases.
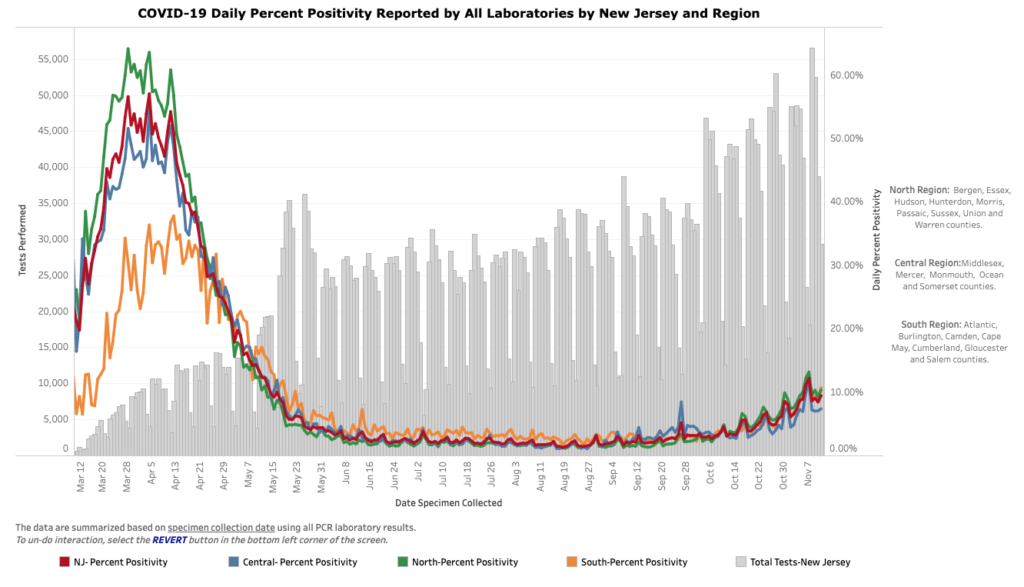
A. Positive test results can only be judged within the context of the number of tests run which allows a percent positive or spot positivity (as NJ reports) to be calculated. Unfortunately, NJ does consistently report the number of tests run hence they rarely report spot positivity. Furthermore, a one day spot positivity can be impacted by that days testing and/or results. In order to truly understand how case are trending a 7-day rolling average should be reported. Here is a look at our Percent Positivity from 11/17/2020 over time. As you can see from the State’s own graph cases reported in the context of percent positivity give a better representation of NJ’s second wave. But there is still a fundamental flaw in this metric. It relies on PCR testing.
B. The results of PCR testing are highly dependent on the number of cycles run. The C.D.C.’s own calculations suggest that it is extremely difficult to detect any live virus in a sample above a threshold of 33 cycles, while most labs run 37 cycle or higher. For example Massachusetts uses a threshold of 40. If they used a threshold of 30 cycles then 85 – 90% of people who tested positive in July would be deemed negative. NY also uses 40 cycles, but if they were to use 35 cycle, about 43 percent of those tests would no longer qualify as positive. About 63 percent would no longer be judged positive if the cycles were limited to 30 cycle according to a NYT report.
C. A final issue with cases is the timing at which they are reported. Cases reported each day do not translate to cases identified that day. New cases aren’t always new, but newly received. For example, of yesterday’s (11/17/2020) ~4000 cases, one third of them were people who tested positive over a week ago. Although they still count as cases, it is not useful in tracking our second wave in real-time.
So, although cases are better viewed in the context of percent positivity, those numbers are still significantly inflated due to the high cycle counts of PCR testing. Furthermore, they are not reported in matter that is relevant to real-time analysis of our second wave. Most importantly, a positive test result for SARS-CoV-2 does not indicate COVID-19. Let’s look at hospitalizations next to determine the level of COVID-19 in our second wave.
3. Hospitalization: COVID hospitalizations are a better indicator of NJ’s second wave but a few important trends need to be kept in mind.
A. There is always a seasonal increase in hospitalization in the fall and winter. Current hospitalizations in NJ are in line with past years for early November. This year had an 0.5% increase (additional 66 people) in NJ hospitals from November 1st to 9th compared to the average from 2016 to 2018 for same dates.
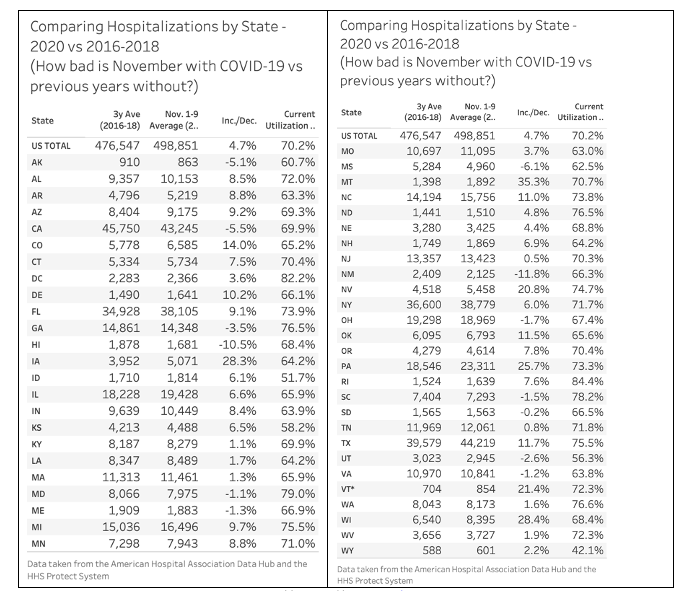
Table created by @justin_hart; sources:
American Hospital Association Data Hub: https://guide.prod.iam.aha.org/stats/; HHS Protect Public Data Hub https://protect-public.hhs.gov/
B. Our hospital occupancy breakdown as of November 15, 2020 per HHS Data: 2,154 or 9.6% of our beds are consumed by COVID patients; 14,259 or 63.7% of beds are consumed by non-COVID patients; 5,972 or 26.7% of beds are open. These hospital numbers are clearly increasing as yesteraday (11/17/20) an additional 205 COVID patients were admitted to NJ hospitals.
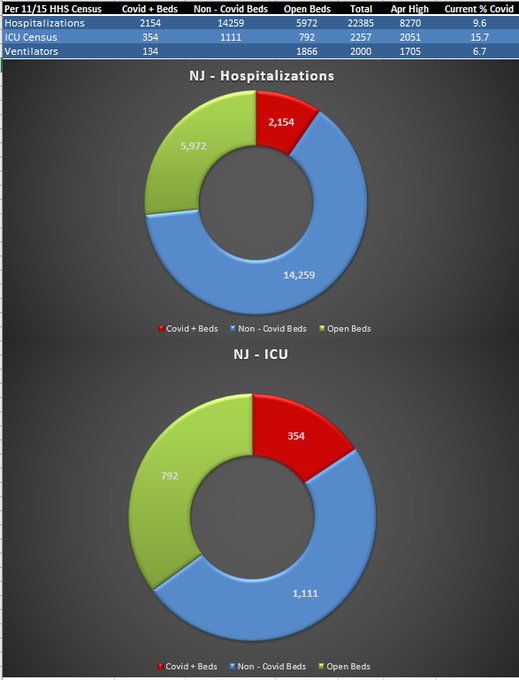
Graph created by @foogatwo; source: HHS Data https://healthdata.gov/dataset/covid-19-reported-patient-impact-and-hospital-capacity-state-timeseries
C. NJ does not distinguish between hospitalization “from” or “with” COVID. To illustrate how this can be misleading, Iowa is a state that does differentiate. If, like most states, they did not differentiate, Iowa’s COVID hospitalizations would be overstated by 27%. Although it may not be this high in NJ, we simply do not know. To further illustrate this point here is a graph of hospital patients that were admitted without COVID but contracted it in the hospital starting in March. The total of hospital onset COVID stands at just under 80 patients in mid-November.
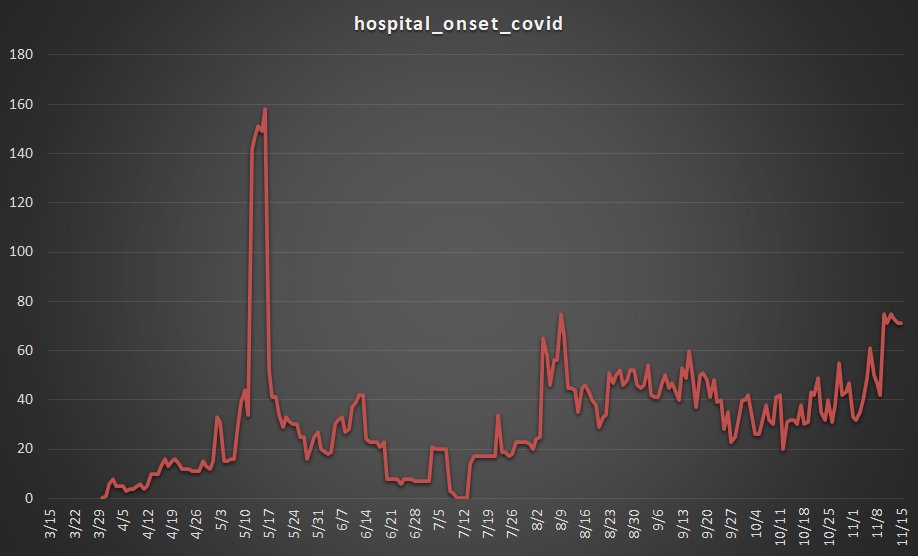
Graph created by @foogatwo; source: HHS Data https://healthdata.gov/dataset/covid-19-reported-patient-impact-and-hospital-capacity-state-timeseries
D. It is worth noting that that influenza prevalence has decreased significantly around the world as COVID-19 has increased. It seems that COVID/Pneumonia has replace the Flu/Pneumonia in many hospitals.
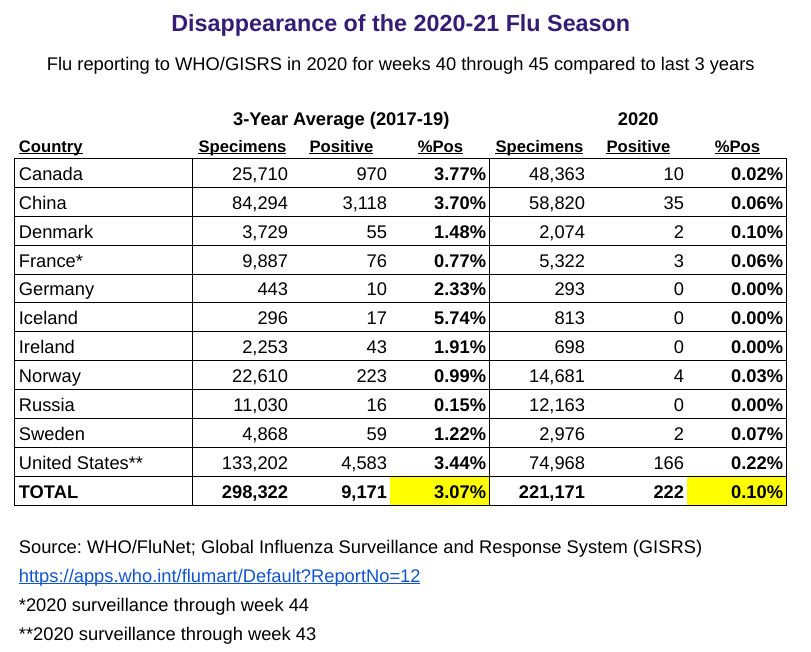
Table created by @kylamb8; sources referenced above
Hospital admissions are increasing as they do every year in the fall. At this point our hospitals are not yet overwhelmed by COVID patients. The trend in hospitalizations is concerning and that leads us to our most important indicator of NJ’s second wave, COVID-19 deaths.
4. Deaths: COVID-19 deaths are sadly the most accurate measure of the magnitude of NJ’s second wave. It is important to keep in mind the seasonal increase in deaths primarily due to endemic respiratory viruses, how NJ reports deaths, and take into account the number of deaths caused by our mitigation efforts like lockdowns.
A. Past seasonal deaths can be calculated by looking at NJ deaths by month for the years 2016 – 2019. There is an average week after week increase of about 100 deaths per week from the end of September to the end of December. Although we may begin to surpass the average number of deaths soon, we are yet to do that despite our spike in cases beginning well over a month ago.
B. As with cases, the day deaths are reported does not represent the actual number of deaths that day, but rather deaths that completed the certification process that day. For example, of yesterday’s (11/17/2020) 38 reported deaths a third of them were old (3 occurring from 32 to 58 days ago; 13 occurred from 77 to 216 days ago) while 24 are recent (occurred from 3 to 27 days ago). While this date of death distinction does not matter from a general perspective, it is relevant to tracking the magnitude and timing of NJ’s second wave. Websites like Worldometers and Coronavirus Dashboard simple report and graph the deaths reported each day as if they actually occurred on that day. Due to this it is important to use NJ’s “COVID-19 Deaths in NJ by Date of Death” graph on the NJ COVID Dashboard to track deaths.
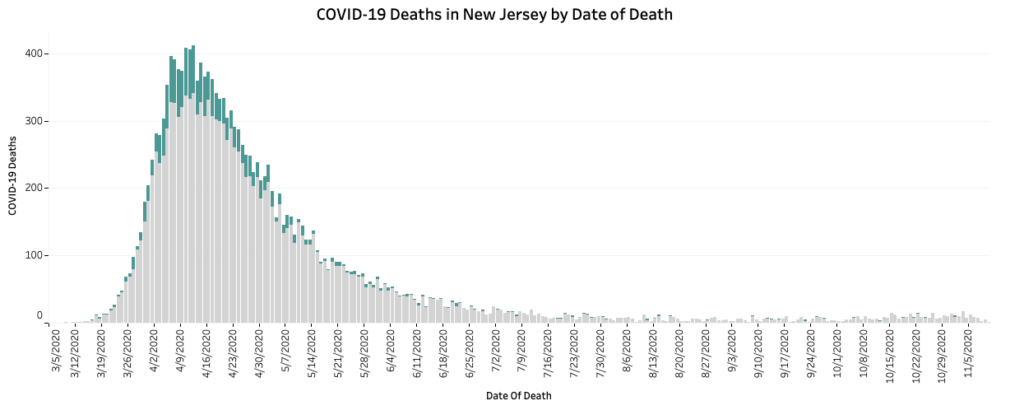
C. The goal of public health is to reduce all harms to a population. In order conduct a cost-benefit analysis of mitigation strategies we must know their benefits and harms. For the purpose of this discussion we will ignore the mounting evidence that lockdowns and school closures may not even reduce COVID-19 deaths, but actually increase them, and simply focus on the deaths associated with the lockdowns as a general mitigation strategy. The best overall analysis I’ve seen on this is @EthicalSkeptic on twitter. Although this is an anonymous twitter account and it is not specific to NJ, all calculations are referenced and clearly laid out. He estimates that there have been 95,818 lockdown deaths as of the last week in October.
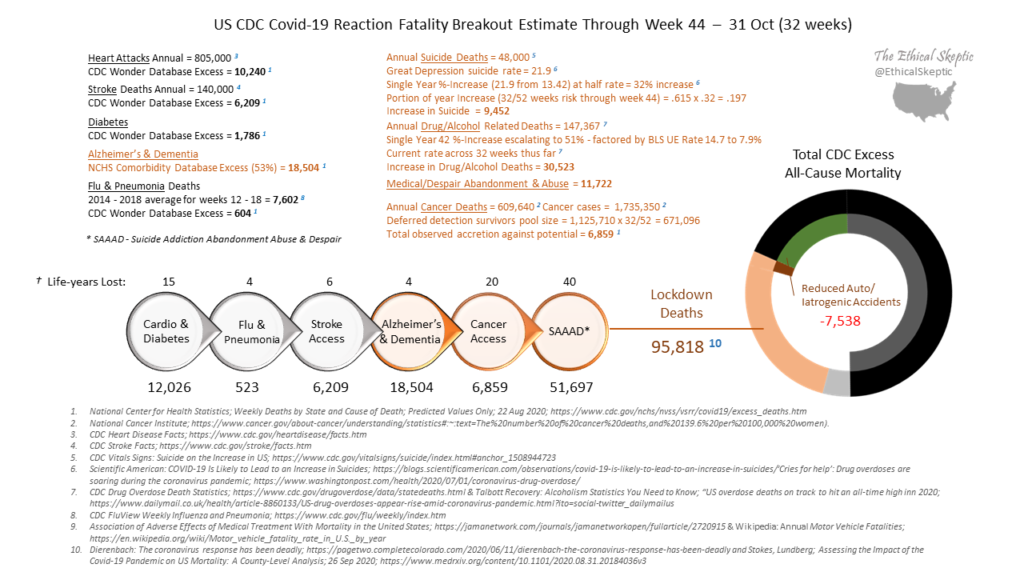
Sadly, deaths are the most accurate way to judge NJ’s second wave. It is important to keep in mind that deaths increase throughout the winter every year and we are not above normal seasonal deaths yet. When deaths are reported, remember those deaths are not from that date but may be scattered over weeks and months in the past. Finally, we are not only losing lives to COVID-19, but also to the reaction to COVID.